I Built a DIY E-Ink Weather Station Because Checking My Phone Was Too Hard
An M5Stack Paper weather monitor that tracks pollen, predicts rain, roams WiFi networks, encrypts your API key with AES-256, and has humbled me with some truly spectacular bugs.

(No, I'm not being dramatic.)
Look, I get it. You have a perfectly good smartphone. It tells you the weather. It has a little sun emoji if it's sunny, a little rain cloud if it's not, and a row of numbers you mostly ignore. It works. It's fine.
But somewhere between scrolling through a news app at 6 AM and wondering whether to grab an umbrella, I thought: what if I had a gorgeous e-ink display on my desk that just... told me? No swipe, no app, no accidentally opening Instagram instead?
That thought kicked off the M5Paper Weather Monitor — an open-source, ESP32-powered weather station built for the M5Stack Paper. What started as "it shows the temperature" eventually became something that tracks pollen, predicts rain before your commute, roams between WiFi networks like a tiny enterprise device, and encrypts your API key with AES-256. Not all at once, and not without a few embarrassing detours along the way.
Here's the story.
The Hardware
The M5Stack Paper is a credit-card-thick slab built around an ESP32 chip and a 4.7-inch e-ink display. E-ink is the same technology used in Kindle readers — crisp, readable in sunlight, and so power-efficient it makes regular LCD screens look like space heaters.
The tradeoff? Updating the screen takes a moment and looks like a camera flash. Updating it too often looks like a strobe light. A lot of the design work in this project was about making the display feel alive without triggering anything you'd need to file an incident report about.
The rest of the hardware is charmingly minimal: a scroll wheel with a button, a capacitive touchscreen, a hardware real-time clock that keeps accurate time even when the WiFi is down, and a LiPo battery that makes the whole thing portable.
Perfect for a desk. Terrible for an action movie.
Getting It to Just Work
The first goal was simple: show the weather. Pull live data, put it on the screen, don't catch fire.
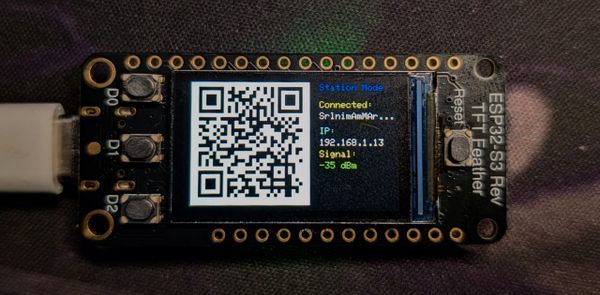
For setup, I wanted zero hardcoded credentials. No opening a config file, no serial terminal, no recompiling to change your WiFi password. The device boots into an access point, displays a QR code, you scan it with your phone, and a setup page opens at 192.168.4.1. Enter your WiFi networks, your Google Weather API key, your location, and tap Save. Done.
Weather data comes from the Google Weather API v1 — a clean REST API that returns current conditions and a 10-day forecast in JSON. One thing that isn't obvious from the documentation: the default response only includes 5 forecast days. Adding pageSize=10 to the forecast request unlocks all 10. That single parameter was the difference between "a 5-day forecast" and "a 10-day forecast," so it felt worth noting.
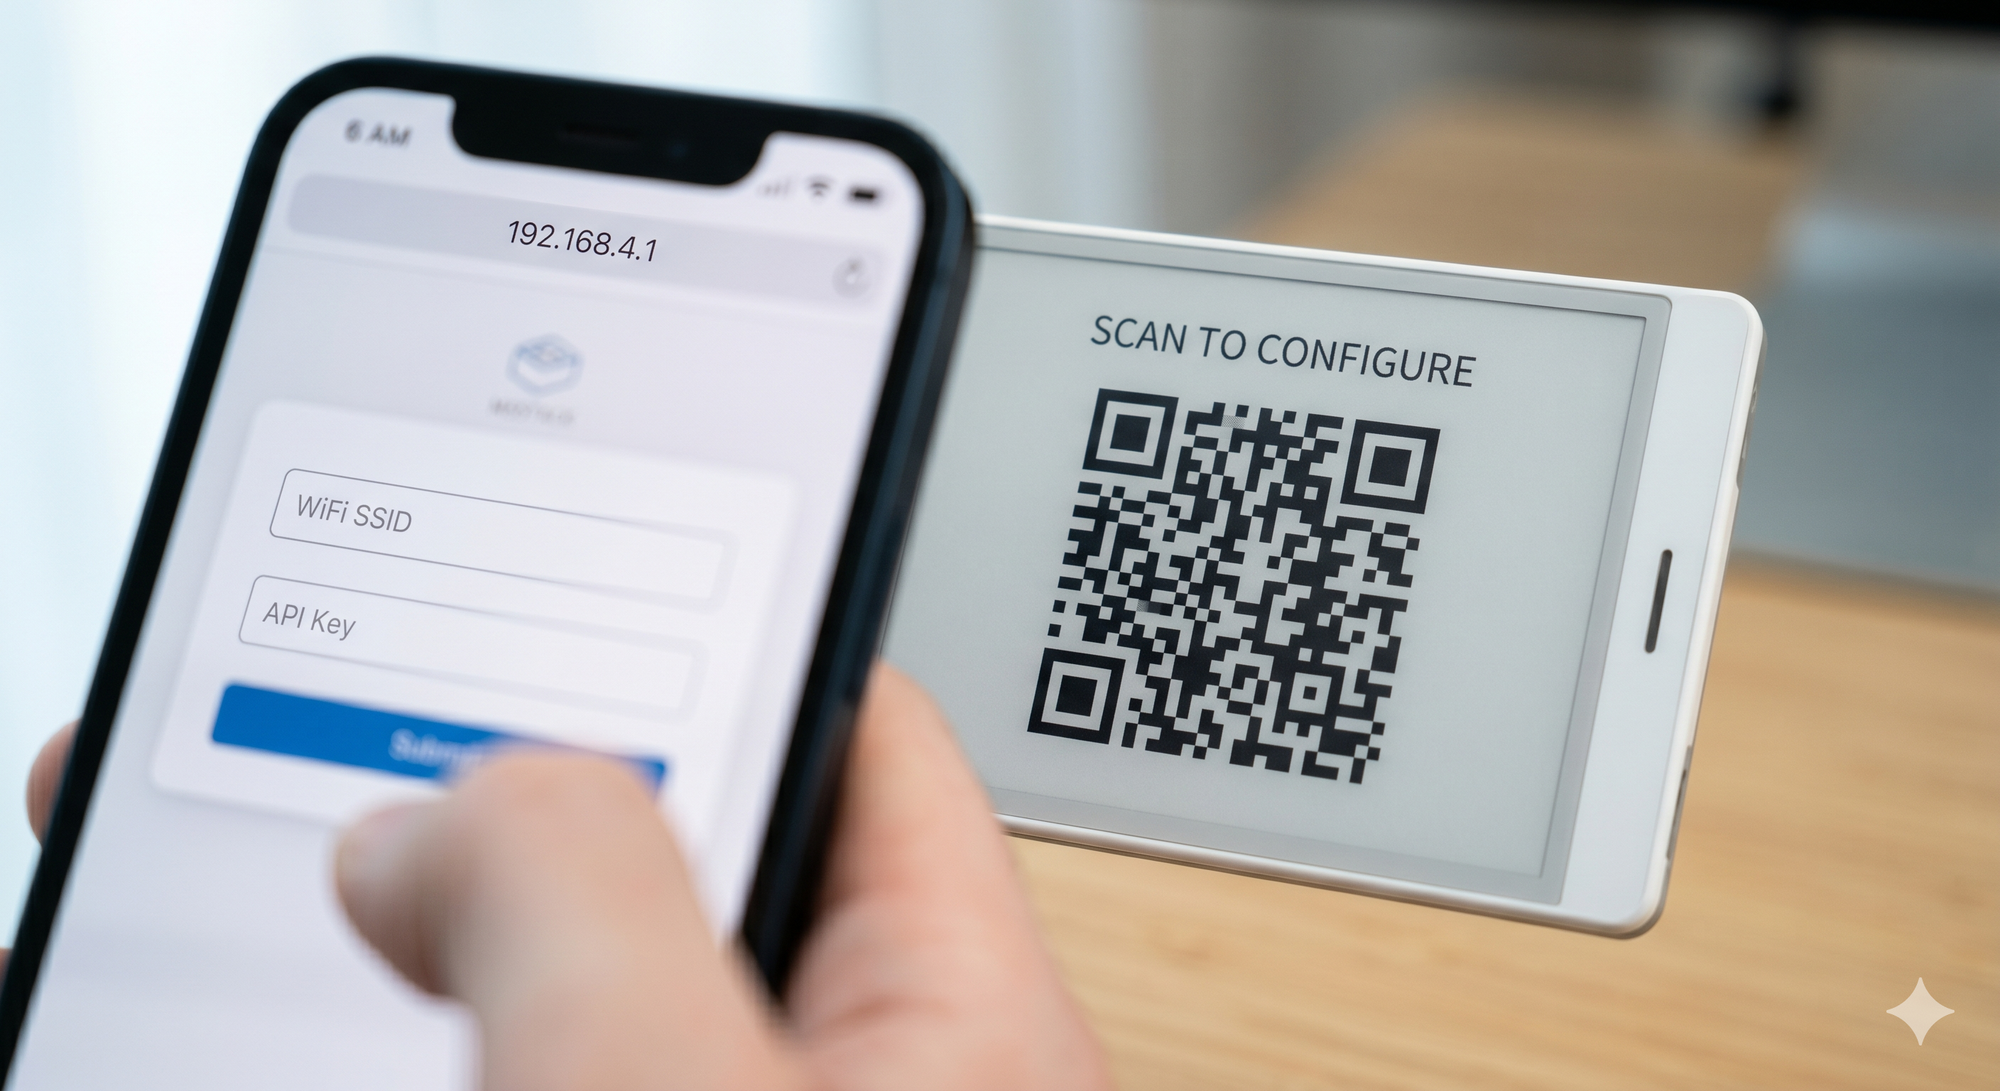
Scan, fill in your credentials, tap Save — no serial terminal required.
WiFi provisioning flow — from AP mode to connected in under a minuteFirst weather fetch and render right after provisioning completes
Time sync happens over NTP via pool.ntp.org, with POSIX timezone strings so the clock shows your actual local time instead of UTC. The hardware BM8563 real-time clock keeps ticking between syncs so the device knows what time it is even when WiFi is unavailable.
The code was structured into proper modules from the start — App, Config, Display, Input, Network, Provisioning — because refactoring a monolith is the kind of fun nobody signs up for twice. The first working version also got full Doxygen documentation, because future-me has been burned by past-me's "this is obvious" comments that were, in fact, not obvious at all.
Making It Feel Like a Real Product
Once the basics worked, the next thing I wanted was for the device to feel polished — not like a prototype you only show to people who ask what it is.
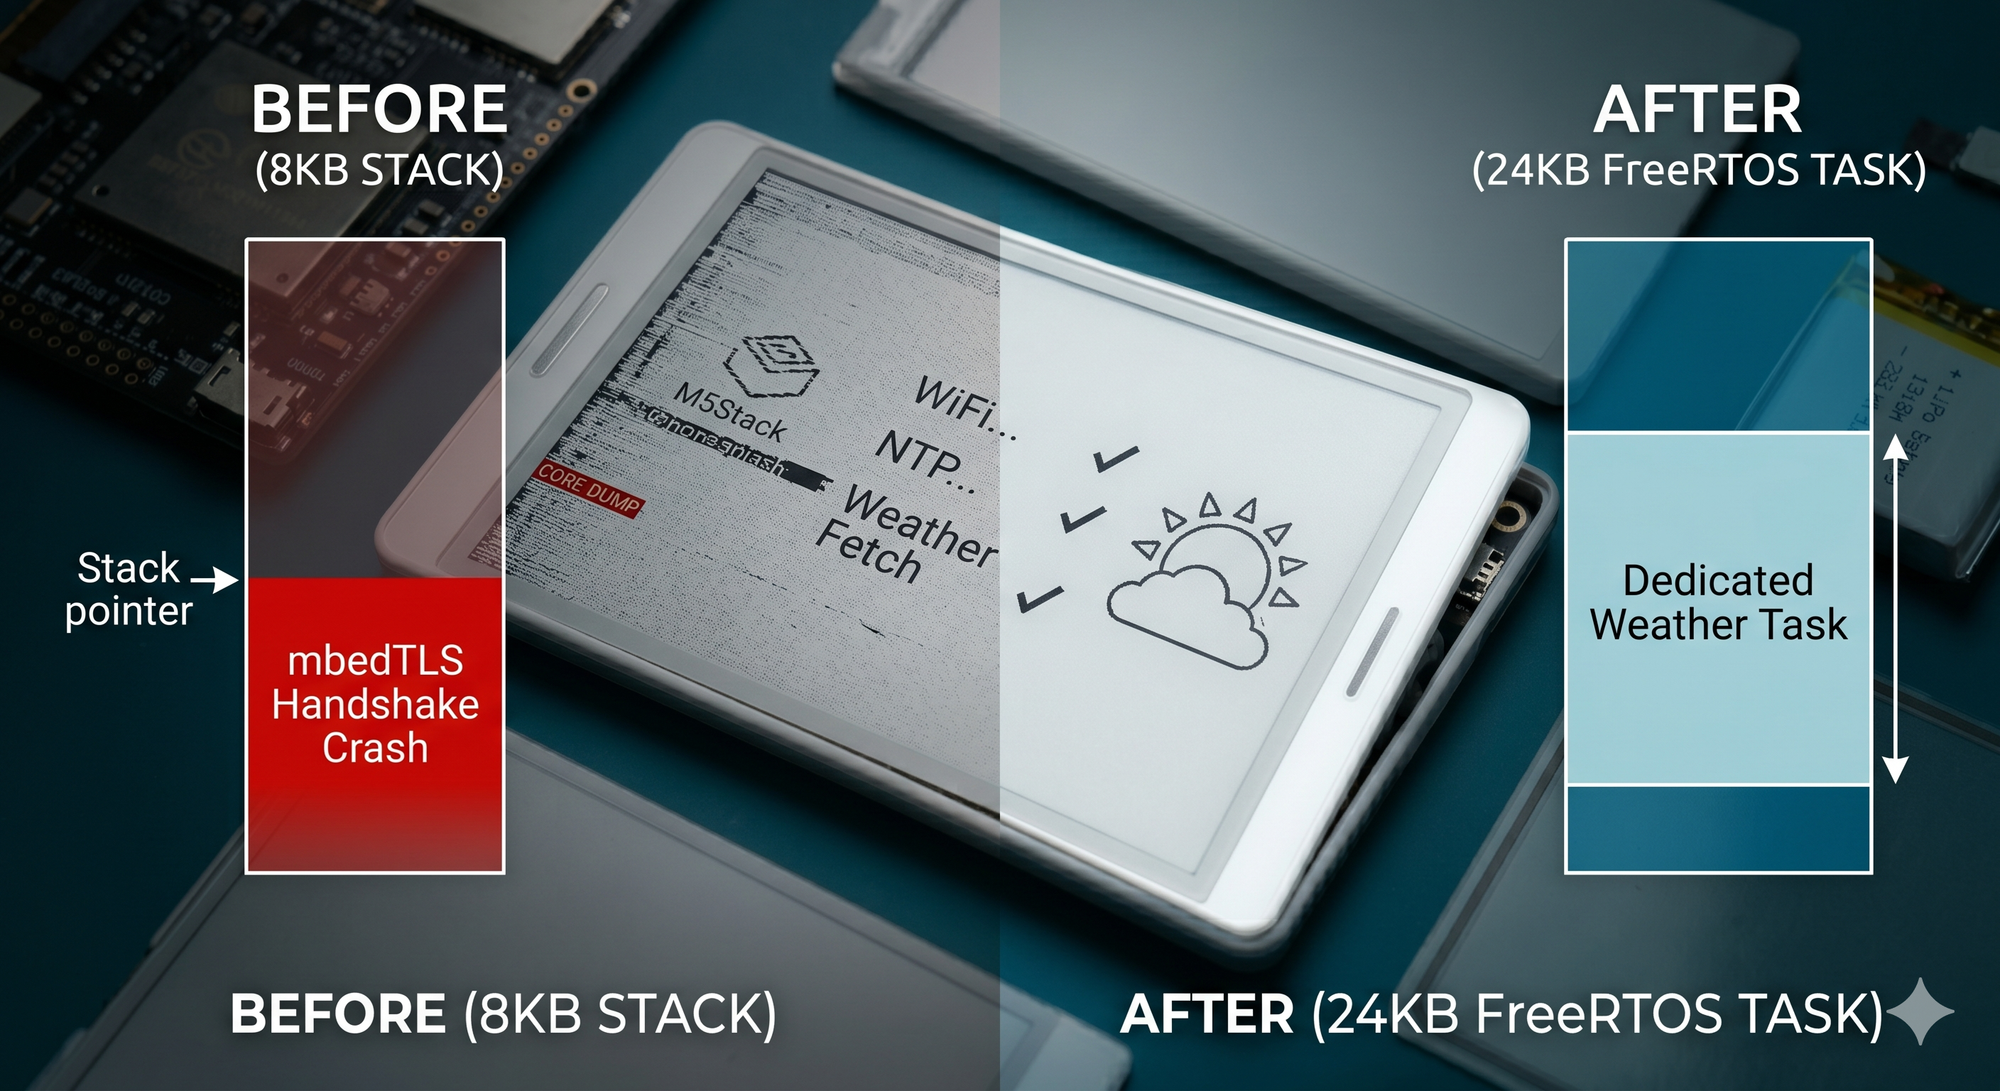
The first addition was a proper loading screen. Instead of a blank display while the device connected and fetched data, there's now an animated progress bar — WiFi → NTP → Weather — with a cloud-and-sun illustration and per-step checkmarks. The trick was making only the progress indicator update with a fast partial refresh while the static artwork stays untouched. No full-screen flash on every step. It looks intentional, not accidental.
Then the settings menu got redesigned. What had been a text list became a three-column icon grid: a circular-arrow Sync icon, a WiFi arc for Setup, and a crescent moon for Sleep. Each column is a tap zone. The device detects whether a touch was a tap (no horizontal movement) or a swipe (over 30 pixels of delta-X), so the menu triggers reliably without interfering with forecast scrolling.
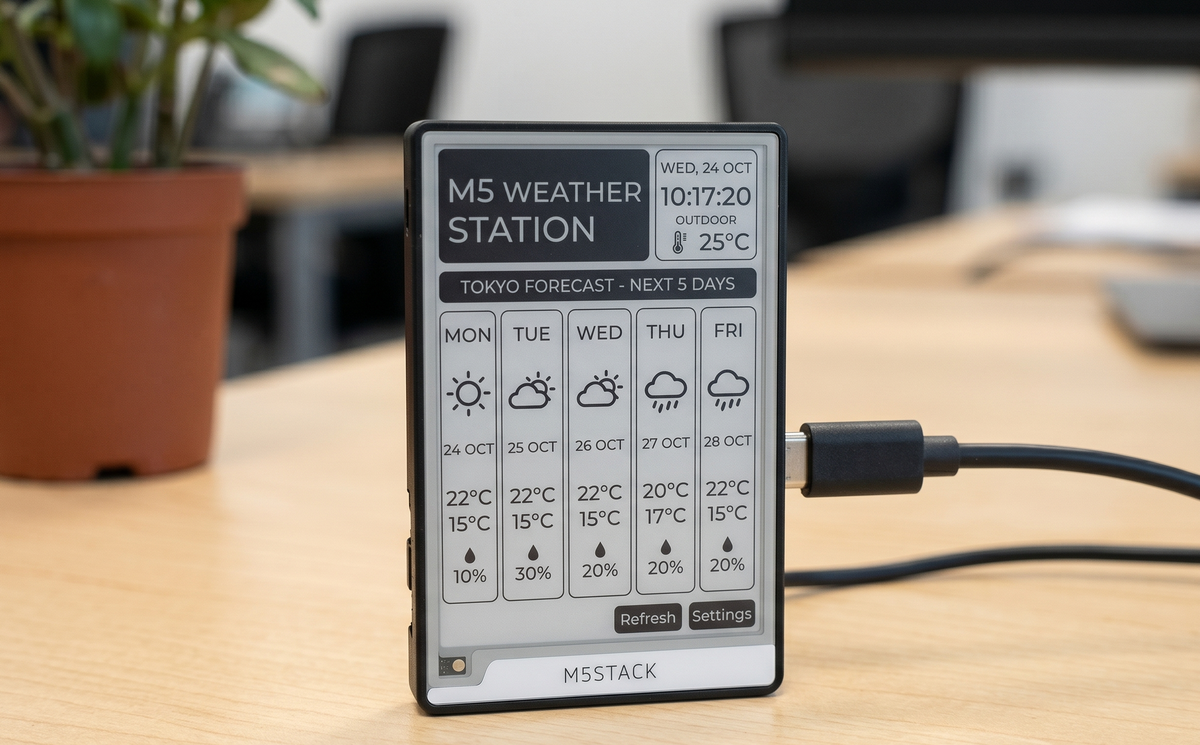
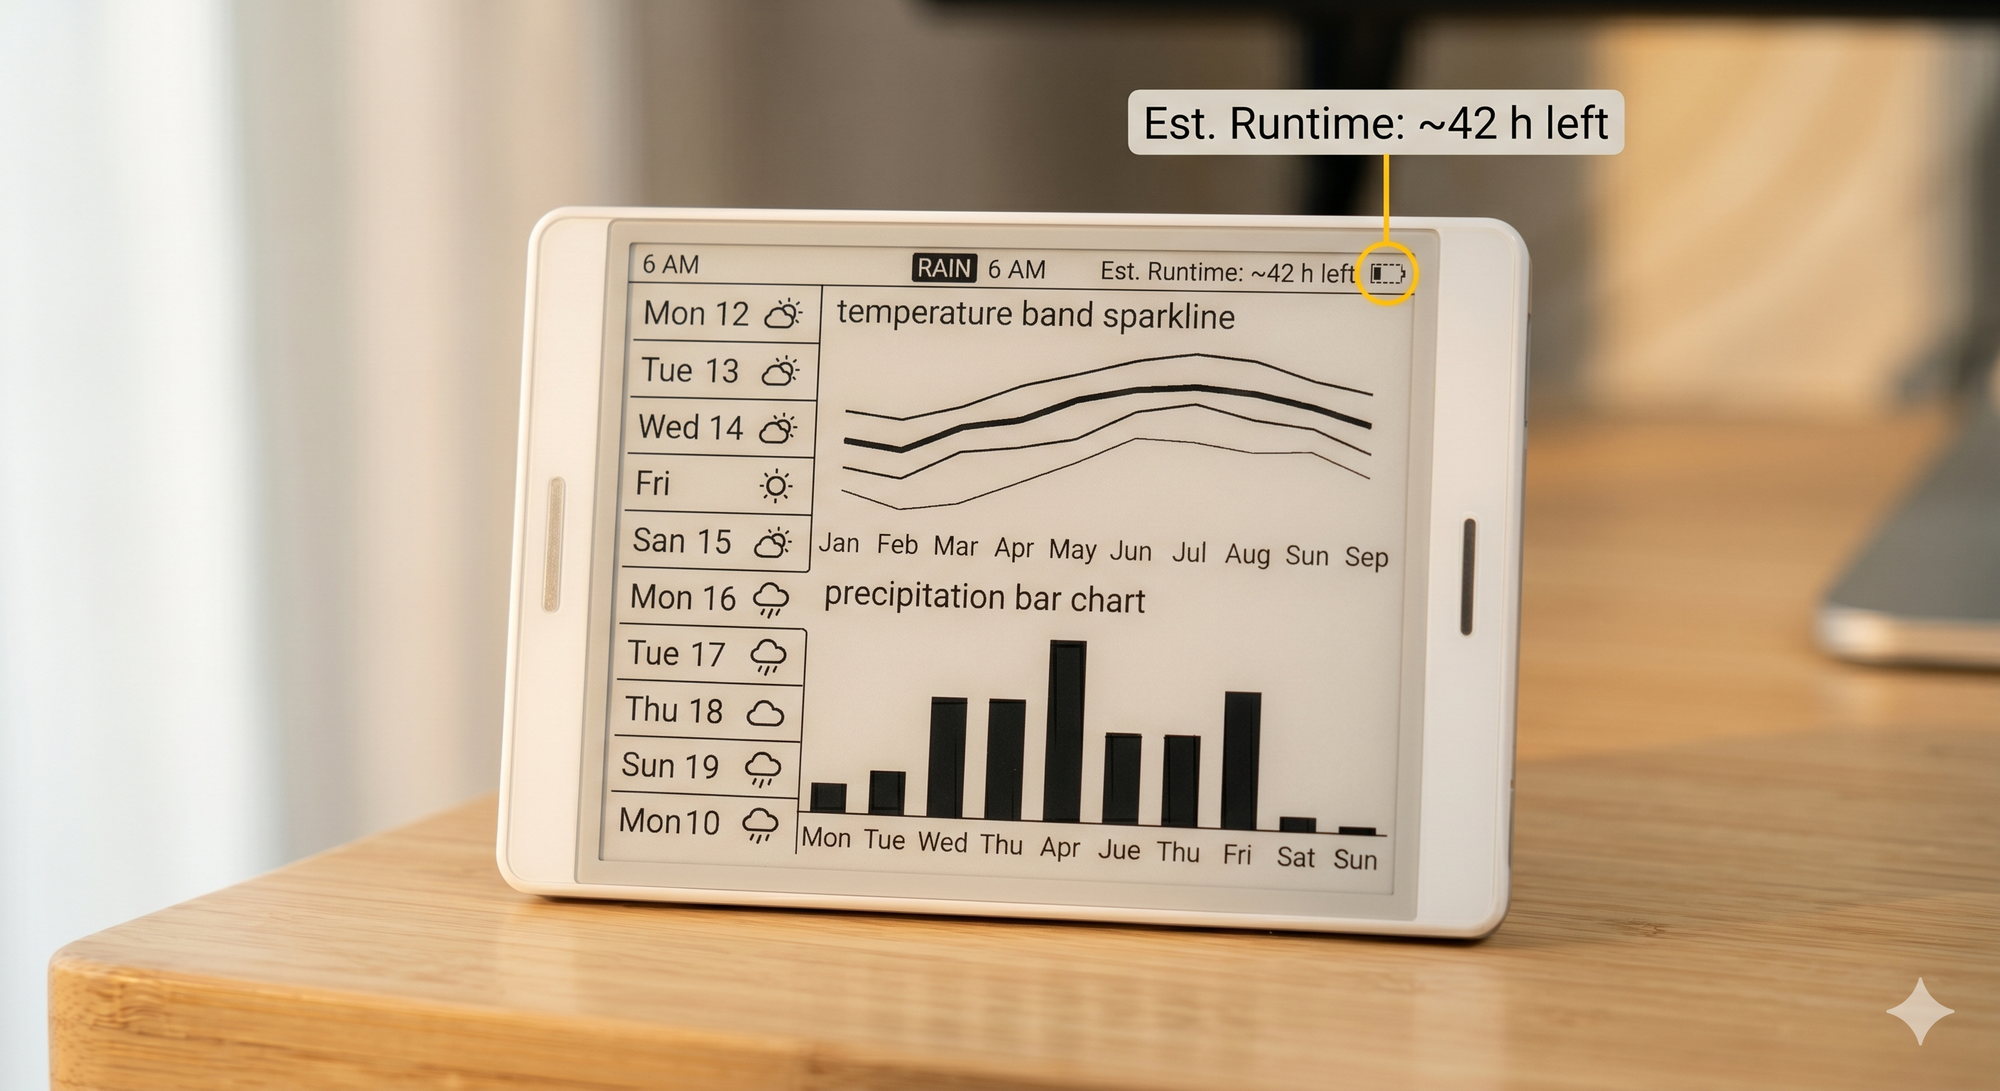
The forecast page grew two charts: a temperature band sparkline (thick daily high line, thin daily low line, across all 10 days) and a precipitation bar chart (vertical bars for rain probability per day, aligned to the same grid). Both draw from the already-fetched forecast data — no extra API calls, just two pass-throughs over the DailyForecast array.
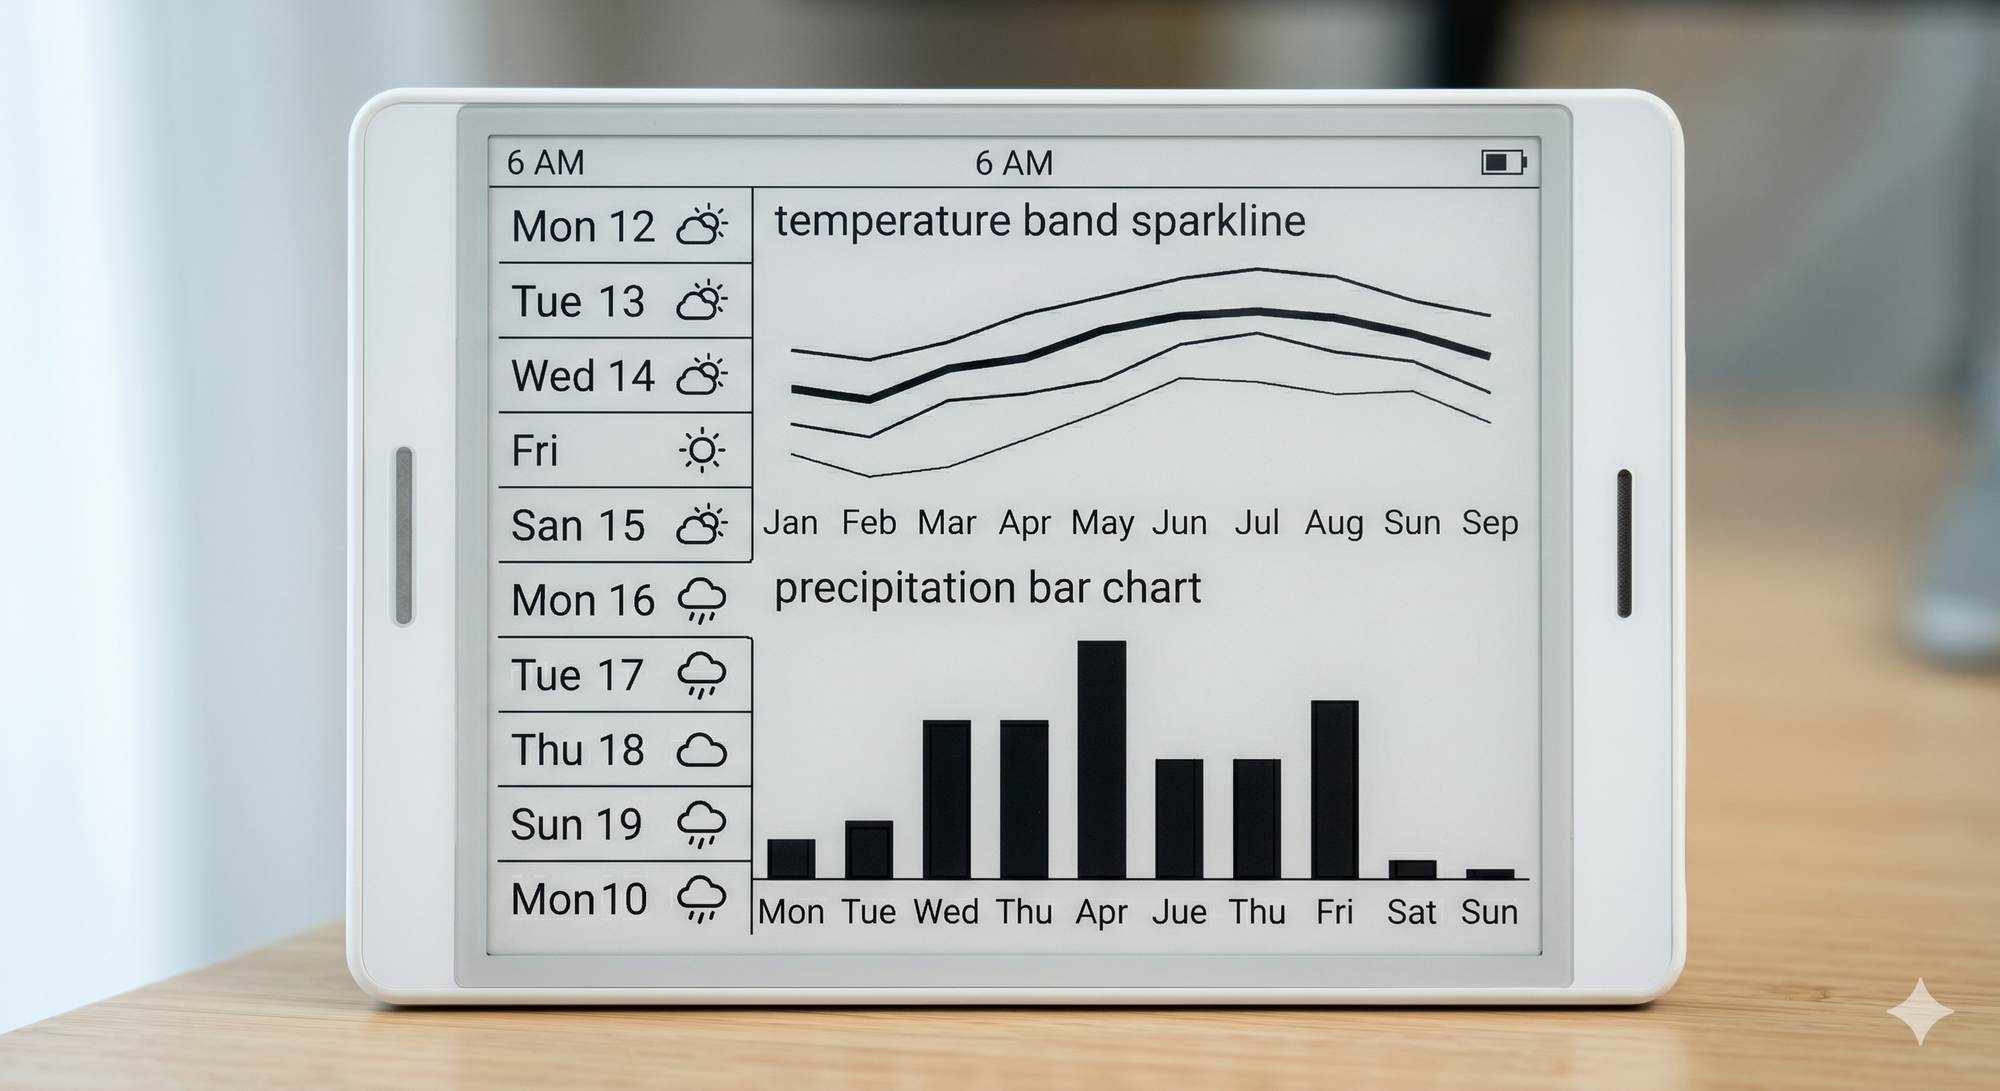
10-day outlook: temperature band on top, precipitation probability bars below, weekday labels throughout.
Forecast cards got real weekday labels too. The Google Weather API returns each day's start time as an RFC 3339 timestamp (2026-03-07T13:00:00Z). Running that through strptime and mktime gives a time_t you can format as "Mon 12". Before that fix, every card said "Day 4" or similar, which is technically correct and practically useless.
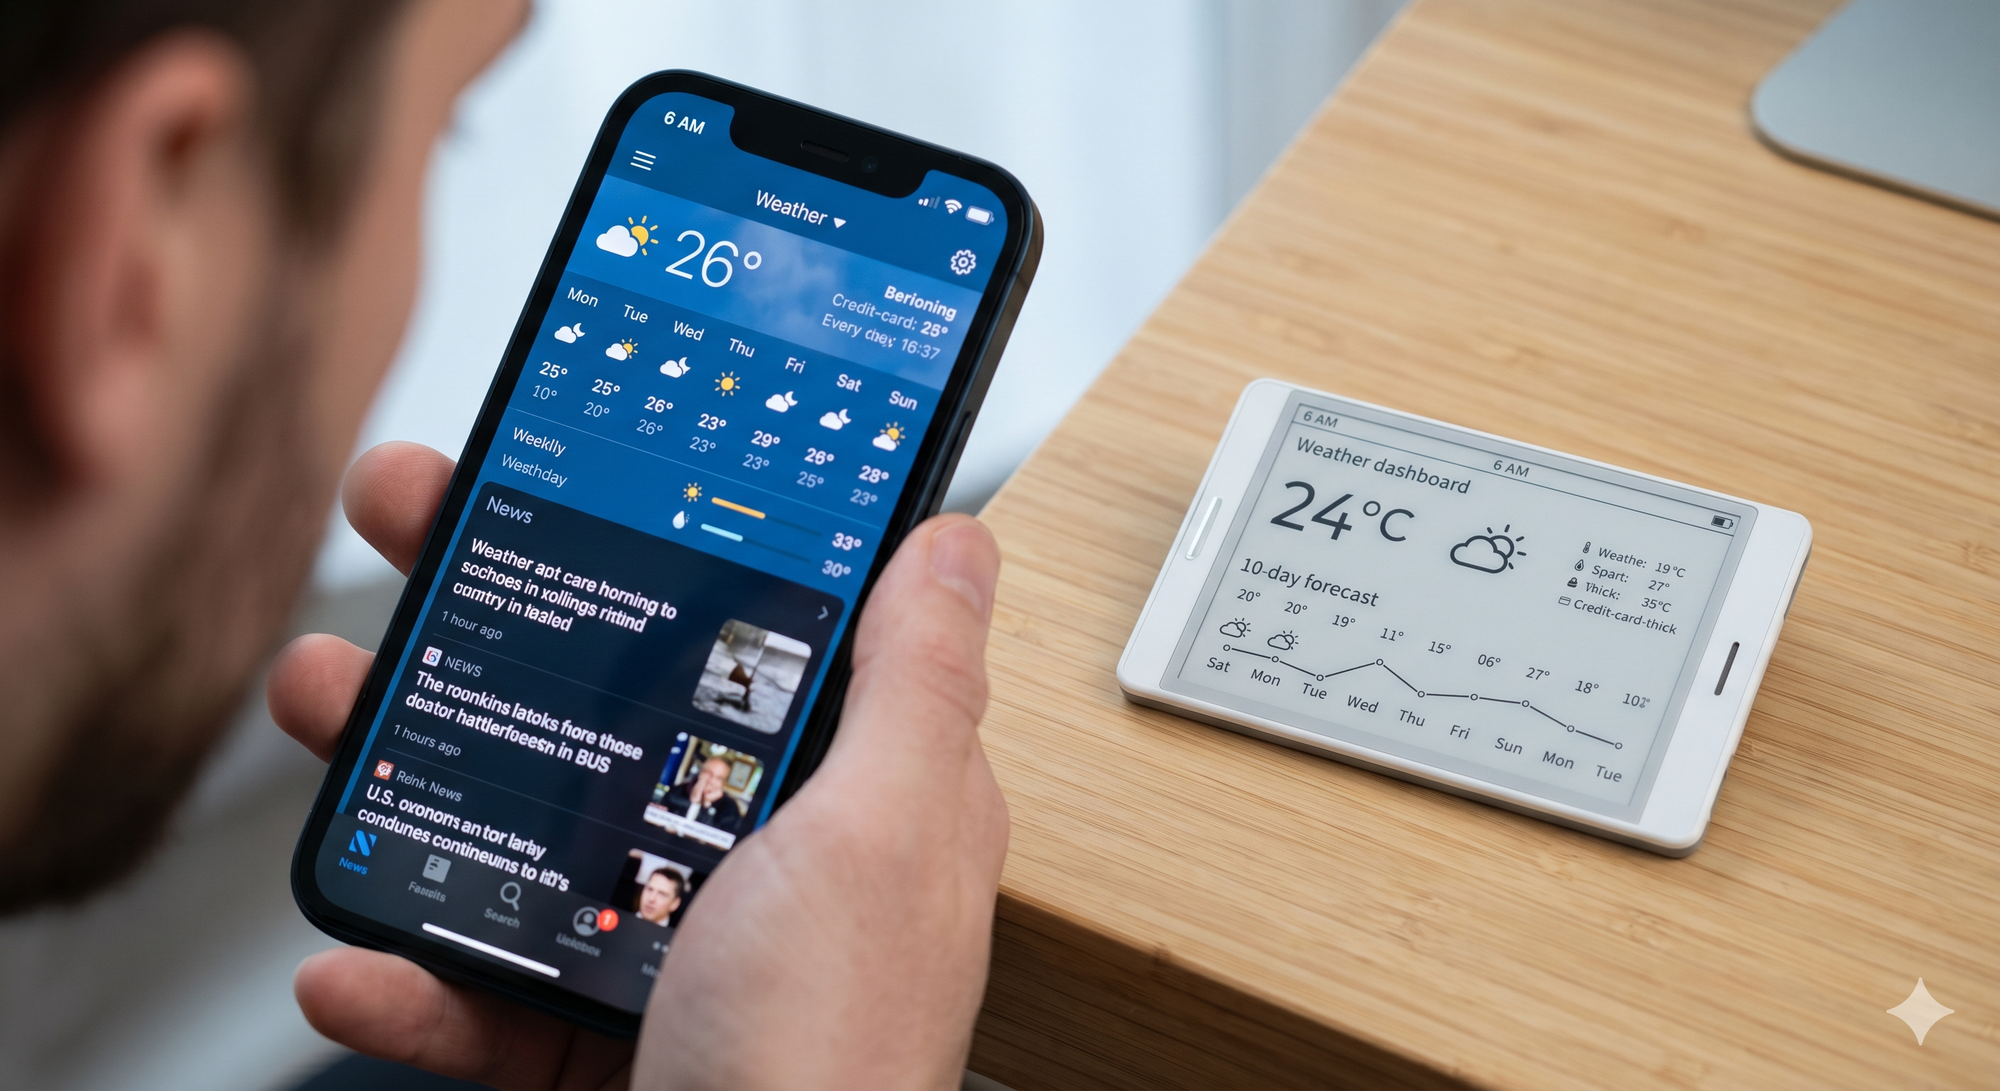
The main dashboard — current conditions, wind, UV, AQI, and a moon phase glyph, all on a 4.7-inch e-ink panel.
Going Deeper
At some point "weather station" stopped feeling like enough of a description.
Credentials got a proper security upgrade: AES-256-CTR encryption for everything sensitive stored on the device. WiFi passwords, the API key, webhook URLs — all encrypted before hitting the ESP32's non-volatile storage. The encryption key is derived from the device's factory-burned eFuse MAC address via SHA-256, which makes the ciphertext hardware-bound. A raw NVS dump from one chip is useless on a different chip. A fresh 16-byte random IV from the hardware TRNG on every write. The stored format is "E1:" + Base64(IV || ciphertext). Devices upgrading from older firmware get their credentials auto-migrated on first boot — no re-provisioning required.
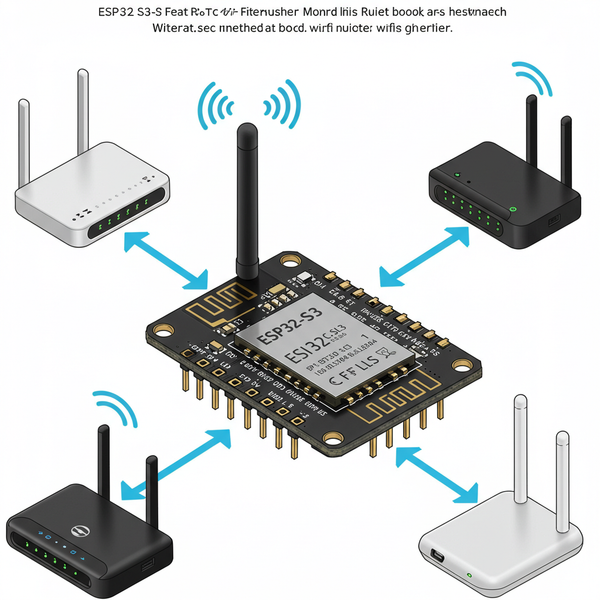
WiFi management got upgraded to roam across up to 5 networks. On every wakeup the device performs an active scan, ranks each matching SSID by signal strength, and connects to the best available network. A fast-connect cache in RTC memory (BSSID + channel) lets it skip the scan entirely when the previously-connected network is still the best option. Enterprise-grade roaming logic, desk-toy price.
The UI grew new widgets. A moon phase glyph derived from Unix time shows the current lunar phase — because it was possible and because why not. A wind rose compass renders the prevailing wind direction as an 8-point Cartesian dial with a speed label, replacing a text string that most people skip. A sun arc dial plots the sun's current position across the sky, flanked by sunrise and sunset times pulled from the free Open-Meteo API.
A 24-hour hourly forecast page joined the Dashboard and 10-Day Forecast. Each card shows the hour, a weather icon, temperature, precipitation chance, and wind speed. The data comes from Open-Meteo — unauthenticated, no API key, free.
Swiping up on the touchscreen opens a detail overlay that slides up from the bottom of whatever page is showing. It reveals AQI with an EPA category label (Good / Moderate / Unhealthy / etc.), any active weather alert headline and severity, and an estimated dew point. The kind of information that isn't interesting every day but is very interesting on the days it matters.
A double-click webhook let the device become a physical trigger for anything with an HTTP endpoint. Double-tap the scroll wheel, the device fires a GET request to a user-configured URL and shows a brief on-screen confirmation. Home automation, notification relay, a button that does something — it's open-ended by design.
For power, a battery-adaptive sync rate doubles the sleep interval automatically when the battery drops below 40%. The device takes care of itself. And a configurable sync interval in the provisioning portal replaced the hardcoded 30-minute window — because some people want updates every 10 minutes, and some people don't care until tomorrow morning.
The Bugs That Humbled Me
Here is where I have to be honest.
There was a period where the device appeared to work correctly. It booted. It showed weather. Everything seemed fine. And then I started looking closely at things I had assumed were working, and discovered that several of them were not.
The device was crashing on every single boot. The mbedTLS TLS handshake — the thing that makes HTTPS connections secure — requires around 8–10 KB of stack space. The default Arduino loop task has 8 KB. The firmware wasn't failing gracefully; it was overflowing the stack canary and getting rescued by the ESP32's watchdog timer on every boot cycle. The fix was spawning a dedicated FreeRTOS task with 24 KB of stack for all the application logic. setup() now returns immediately; all the real work runs in the task. The device has booted cleanly ever since.
NTP time sync never actually completed. The ESP32's default NTP sync mode (SNTP_SYNC_MODE_SMOOTH) uses gradual adjtime() adjustments. In this mode, SNTP_SYNC_STATUS_COMPLETED is never set — the status cycles endlessly between IN_PROGRESS and RESET. The firmware was waiting for a completion signal that the hardware was constitutionally incapable of sending. Every sync attempt timed out, and the clock fell back to whatever the hardware RTC said. Fixed by switching to SNTP_SYNC_MODE_IMMED and capturing the sync result in a local boolean rather than re-querying the volatile status flag after the polling loop — which was a race condition disguised as working code.
AQI was zero in every release. The Open-Meteo Air Quality API uses ragweed_pollen as its parameter name for weed pollen data. The code was sending weed_pollen. The API returned HTTP 400 Bad Request for every single AQI request, which the firmware interpreted as "zero, I guess," and carried on. The pollen counts had never worked. The fix was three characters. The lesson was: test the actual HTTP response, not just whether the parsing succeeded.
Touch events were silently disappearing. Adding a dedicated FreeRTOS task for application logic introduced a race condition. The InputTask on Core 0 and the loopTask on Core 1 were both calling M5.update(). The wasPressed() and wasReleased() functions are one-shot edge flags — call them twice and the second caller always gets false. The loop task was consistently beating the input task to the flag and clearing it before any gesture could be detected. The fix was simple: InputTask exclusively owns M5.update(). loop() does not call it. One task, one owner.
Each of these bugs had a clean fix. Each of them had also been silently misbehaving for weeks while the device "appeared" to work. Embedded development has a particular talent for making broken things look fine until you measure them carefully.
The moment of reckoning — stack overflow diagnostics that revealed the firmware was crashing on every single boot.
The Battery Story
The original battery percentage display used a linear voltage-to-percentage mapping. Simple math. Completely wrong.
Real LiPo cells don't discharge linearly. They have a characteristic discharge curve: voltage holds relatively steady through most of the discharge cycle, then drops quickly near the end. A linear mapping reports 60% when the cell is at 80% capacity, and then the last 20% falls off a cliff. You think you have plenty of battery. You don't.
The replacement is a piecewise-linear LiPo discharge curve — a lookup table of voltage breakpoints with linear interpolation between them, fitted to the actual shape of a LiPo discharge profile. The percentage now reflects what the battery is actually doing.
Alongside that, the battery indicator got visual upgrades: a charging bolt icon (and +82% style label) when USB power is detected, a LOW badge in the clock strip and a dashed fill pattern on the battery bar when the level hits 15% or below.
The most interesting addition was a runtime estimate. A rolling ring buffer of battery voltage samples lives in RTC memory and accumulates readings across wakeup cycles. Once at least two samples exist, the firmware computes a millivolts-per-minute discharge rate and projects how many hours remain above the 3200 mV floor. It's not laboratory-grade accuracy, but it's accurate enough to decide whether you need to charge before a trip. The Settings page shows "Est. Runtime: ~N h left" when the estimate is available.
Standby mode — battery percentage, runtime estimate, and charging indicator all visible at a glance.
More Things the Weather Can Tell You
Once the data pipeline was solid, adding new information to the display became a question of "what does the user actually want to know?" rather than "what do we have to fetch?"
Wind gusts got their own row in the Dashboard. The wind_gusts_10m field was already in the Open-Meteo hourly response — appending it to the existing parameter string cost nothing. Knowing the gust speed is what tells you whether the umbrella will survive.
UV index risk labels turned a number into advice. UV Index: 6 - High is more actionable than UV Index: 6 when most people don't know the scale by heart.
Precipitation type badges on forecast cards map the condition text to a small inverted label: Rain, Snow, Ice, Storm, or Hail. No additional API call, just a string lookup over data already parsed. A card that previously said "Wintry mix, 40%" now says Ice in the corner and you know exactly what that means.
Barometric pressure trend required keeping state across wakeups. Surface pressure from the Open-Meteo hourly response is written into a three-slot ring buffer in RTC memory. Trend is computed as newest minus oldest reading — positive is rising, negative is falling, near-zero is steady. Three readings at the default 30-minute sync cadence gives an approximately one-hour pressure window. Old-fashioned meteorology, implemented in firmware.
Pollen data extended the AQI fetch with three additional hourly fields (grass_pollen, birch_pollen, ragweed_pollen). The firmware scans the next 8 hours, takes the peak value per species, and identifies the dominant one. The Dashboard details grid shows "Pollen: 42 (Grass)" when grass is the worst offender, or whichever species is peaking. Hay fever sufferers now have an actual reason to look at the display.
A rain-before-commute badge checks whether any of the next three hourly forecast entries shows precipitation chance above 60%. If so, an inverted RAIN badge appears in the clock header. It's the first thing visible when you glance at the device in the morning. All from data already cached — no extra fetch, no extra wake.
Adaptive sleep works the same way: if precipitation probability is rising sharply across the next few hourly entries (more than 20 percentage points), the sleep interval automatically shortens to 10 minutes. The device effectively gets anxious about incoming rain so you don't have to.
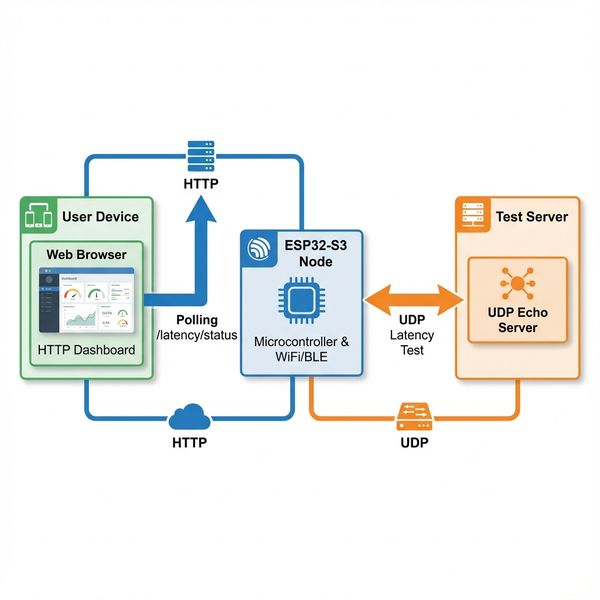
How the Data Actually Gets Here
Every timer wakeup runs the same five-request fetch pipeline, back to back, using a shared WiFiClientSecure + HTTPClient pair with a 10-second timeout on each request.
The first call goes to the Google Weather API for current conditions:
GET https://weather.googleapis.com/v1/currentConditions:lookup
    ?key=<API_KEY>&location.latitude=<LAT>&location.longitude=<LON>
This returns temperature, feels-like, humidity, wind speed and direction, UV index, cloud cover, visibility, and the condition text. A currentOk flag tracks whether this succeeded. The other four fetches always run regardless — supplemental data stays fresh even if Google briefly stumbles.
The second call fetches the 10-day forecast:
GET https://weather.googleapis.com/v1/forecast/days:lookup
    ?key=<API_KEY>&location.latitude=<LAT>&location.longitude=<LON>&days=10&pageSize=10
The pageSize=10 override is required. Without it you get 5 days. Each day's interval.startTime (RFC 3339 format) gets parsed with strptime so forecast cards can show "Mon 12" instead of "Day 4".
The third call goes to Open-Meteo's Air Quality API — free, no key required:
GET https://air-quality-api.open-meteo.com/v1/air-quality
?latitude=<LAT>&longitude=<LON>
¤t=us_aqi
&hourly=grass_pollen,birch_pollen,ragweed_pollen
&timeformat=unixtime&timezone=auto&forecast_days=1
One request gets current AQI and hourly pollen counts for three species. The firmware scans the next 8 hours of pollen data and takes the peak value per species.
Before this call — and before each call that switches to a different hostname — client.stop() is called explicitly to close and clean up the TLS socket. Without it, http.begin() on a different host leaves a stale socket descriptor that triggers errno 9 (EBADF) inside NetworkClient and puts the HTTP client in a broken state. Learned that one the hard way.
The fourth call goes back to Open-Meteo for sun times and hourly forecast data:
GET https://api.open-meteo.com/v1/forecast
    ?latitude=<LAT>&longitude=<LON>
    &daily=sunrise,sunset
    &hourly=temperature_2m,weather_code,precipitation_probability,
            wind_speed_10m,wind_gusts_10m,surface_pressure
    &timeformat=unixtime&timezone=auto&forecast_days=2
One request delivers sunrise/sunset timestamps for the sun arc dial, plus a 24-hour hourly strip. Surface pressure from the current hour also feeds the barometric trend ring buffer.
The fifth call checks for active weather alerts:
GET https://weather.googleapis.com/v1/weatherAlerts:lookup
    ?key=<API_KEY>&location.latitude=<LAT>&location.longitude=<LON>
HTTP 404 means no alerts (or the region isn't supported) — treated as "all clear" rather than an error. When an alert is present, its headline and certainty level get stored in WeatherData and shown in the swipe-up detail overlay.
Once the fetch completes, the entire WeatherData struct gets written to RTC_DATA_ATTR memory — a special region of the ESP32's ultra-low-power RAM that persists through deep sleep. Current conditions, 10-day forecast, 24-hour hourly data, AQI, pollen, sun times, alerts: all of it survives when the main processors shut down and the chip draws microamps.
This is what makes the button-press wakeup feel instant. Press G38, the device wakes, reads the cached struct, and renders immediately. No WiFi, no fetch, no loading screen. The data is already there.
The ring buffers live in RTC memory too — the three-slot pressure ring for barometric trend, and the eight-slot battery voltage ring for runtime estimation.
All rendering goes through a single full-screen off-screen sprite: a 540×960 M5Canvas allocated in 1-bit color depth (pure black and white):
_canvas.setColorDepth(1);
_canvas.createSprite(kWidth, kHeight);
1-bit means the sprite occupies about 65 KB of RAM. It also pushes to the display via DMA roughly 4× faster than 8-bit grayscale. E-ink is black and white anyway. Every draw call — shapes, text, arcs, icons — targets the sprite. Nothing goes to the hardware display until a single pushSprite() call flushes the entire frame as one SPI burst. No tearing, no partial update artifacts.
The display has two refresh modes used deliberately. epd_quality runs the full waveform cycle, takes about 1–1.5 seconds, flashes the screen, and produces the sharpest result. Used for full weather redraws after a fetch. epd_fastest is a partial refresh: much faster, almost no flash. Used for the minute-by-minute clock tick, loading screen step advances, and forecast scrolling.
Every 48 full-quality redraws — roughly 24 hours at the default 30-minute sync interval — the firmware runs a ghost cleanup cycle: white fill, black fill, white fill. E-ink panels accumulate residual charge from previous images over time, leaving faint ghosts. The W→B→W sequence discharges them. You'll see it happen once a day and briefly think something broke. It didn't.
renderActivePage() dispatches to one of four pages depending on _activePage (stored in RTC memory so it persists across sleep cycles): Dashboard, Hourly, Forecast, or Settings. The clock-only update is a special path that redraws just the time strip using epd_fastest, skipping the full sprite composition so the clock ticks smoothly every minute without flashing the screen.
Building It Yourself
The project is open-source on GitHub: arunkumar-mourougappane/esp32-weather-monitor.
You'll need: - An M5Stack Paper (M5Paper V1.1) - A Google Cloud API key with the Weather API enabled (Google offers a free tier) - PlatformIO (the VS Code extension or the CLI) - A USB-C cable and five minutes for the first flash
git clone https://github.com/arunkumar-mourougappane/esp32-weather-monitor
cd esp32-weather-monitor
pio run -t upload
After flashing, the device boots into provisioning mode. Scan the QR code with your phone, enter your WiFi credentials and API key, tap Save & Restart, and you're done.
What I Learned
ESP32 stack sizes are an ambush. The default loop task stack is 8 KB. TLS handshakes need more. The firmware doesn't crash visibly — it recovers via watchdog and you wonder why there's a brief flicker at boot. Spawn a real task.
Volatile flags and race conditions are sneaky. Two tasks calling M5.update() seemed harmless. It silently dropped all touch events for weeks. Single ownership of hardware state is not optional.
API parameter names matter. weed_pollen vs ragweed_pollen. Three characters. Months of zero AQI readings. Read the documentation. Then test the HTTP response code anyway.
E-ink is a constraint that makes you creative. You can't refresh the whole screen every second — users will notice and resent you. Designing a UI that feels responsive while minimizing full redraws is genuinely interesting engineering.
Security is easier than it sounds. AES-256-CTR, SHA-256 key derivation, hardware TRNG — all of it is available in mbedTLS on the ESP32. The API is verbose but the building blocks are there. "It's an embedded device, security doesn't matter" stopped being an acceptable position some years ago.
Final Thought
There's something quietly satisfying about a device that does one thing, does it well, and doesn't need a subscription, an account, or a cloud backend that might shut down someday. The M5Paper Weather Monitor tells you the weather. That's it. No notifications, no algorithmic feeds, no battery that dies at 20% because the firmware lied about the percentage.
Is it more effort than checking your phone? Objectively, yes.
Is it more fun?
Also yes.
The full source code and documentation are at github.com/arunkumar-mourougappane/esp32-weather-monitor. If you build one, I'd love to see it.
⚠️ Disclaimer: The images in this post were lovingly hallucinated by Google Gemini. Yes, I used an AI image generator to illustrate a project that talks to Google's weather API, runs on Google's recommended ESP32 stack, and now has its screenshots touched up by Google's AI. At this point Google basically co-authored the hardware, the data, and the visuals. I wrote the firmware. Mostly. Don't tell anyone.